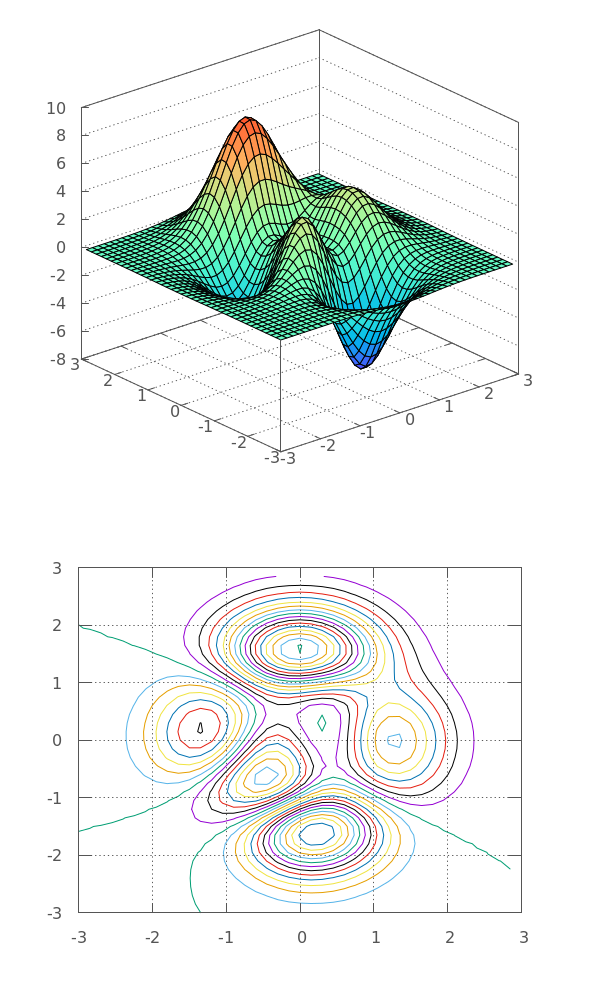
Matlab Peaks
Code
// we use make_data_block() helper function provided
// by G3P to turn our vector into a datablock
auto peaks = make_data_block(gp, grid, 3, 40);

// now we can use it in a multiplot
// NOTE: we mix and match C and C++ conventions here...
gp  ("set term pngcairo size 600,1000")      // make some space for the 2nd plot
    ("set multiplot layout 2,1 spacing 0,0") // switch to multiplot
    << "splot" // start plotting as the rest has been already set
    << peaks   // <-- using peaks once
    << "with pm3d\n";
gp  ("set view map")
    ("set contour")
    ("set cntrparam levels 50")
    ("unset surface")
    << "splot"
    << peaks // <-- using peaks twice
    << "w lines\n"
    << "unset multiplot\n"
Output
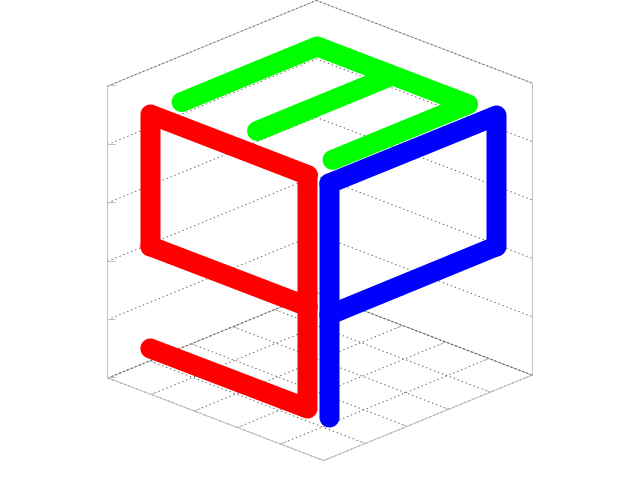
G3P Logo
Here’s G3P logo plotted with G3P! 😀
Code
std::vector<float>
    g //x    y    z
    {   1,   1,   1
    , 8.3,   1,   1
    , 8.3,   1,   9
    ,   1,   1,   9
    ,   1,   1, 4.5
    , 8.3,   1, 4.5
    }
,   e //x    y    z
    {   1, 2.5,   9
    ,   1,   9,   9
    , 4.5,   9,   9
    , 4.5, 2.5,   9
    , 4.5,   9,   9
    ,   8,   9,   9
    ,   8, 2.5,   9
    }
,   p //x    y    z
    { 9.3,   1,   1
    , 9.3,   1,   9
    , 9.3,   9,   9
    , 9.3,   9, 4.5
    , 9.3,   1, 4.5
    }
;
auto lg = make_data_block(gp, g, 3);
auto l3 = make_data_block(gp, e, 3);
auto lp = make_data_block(gp, p, 3);
gp  << "set view 55,44,0.9,1.72\n"
    << "set border linecolor 'grey'\n"
    << "set border 895-32\n"
    << "set xrange [0:10]\n"
    << "set yrange [0:10]\n"
    << "set zrange [0:10]\n"
    << "set grid x y z\n"
    << "unset key\n"
    << "set style line 1 lt rgb 'red' lw 20\n"
    << "set style line 2 lt rgb 'green' lw 20\n"
    << "set style line 3 lt rgb 'blue' lw 20\n"
    << "set ticslevel 0\n"
    << "set format x ''; set format y ''; set format z ''\n"
;
gp << "splot"
    << lg << "u 1:2:3 w l ls 1,"
    << l3 << "u 1:2:3 w l ls 2,"
    << lp << "u 1:2:3 w l ls 3"
    << g3p::endl
Output
Bessel animation
A nice animation from gnuplotting.org
Code
g3p::gnuplot gp;
gp ( "set term gif enhanced transparent animate" )
   ( "set palette rgb 3,9,9" )
   ( "unset key; unset colorbox; unset border; unset tics" )
   ( "set lmargin at screen 0.03" )
   ( "set bmargin at screen 0" )
   ( "set rmargin at screen 0.97" )
   ( "set tmargin at screen 1" )
   ( "set parametric" )
   // Bessel function, which is moving in time
   ( "bessel(x,t) = besj0(x) * cos(2*pi*t)" )
   // calculate the zeros for the bessel function (see Watson,
   // "A Treatise on the heory of Bessel Functions", 1966, page 505)
   ( "n = 6 # number of zeros" )
   ( "k = (n*pi-1.0/4*pi)" )
   ( "u_0 = k + 1/(8*k) - 31/(384*k)**3 + 3779/(15360*k)**5" )
   ( "set urange [0:u_0]" )
   ( "set vrange[0:1.5*pi]" )
   ( "set cbrange [-1:1]" )
   ( "set zrange[-1:1]" )
   ( "set isosamples 200,100" )
   ( "set pm3d depthorder" )
   ( "set view 40,200" )
;
for (float t = 0; t < 2; t += 0.02)
    gp ( "splot u*sin(v),u*cos(v),bessel(u,%f) w pm3d ls 1", t);

gp ("unset output")
Output