Terminals supporting animation
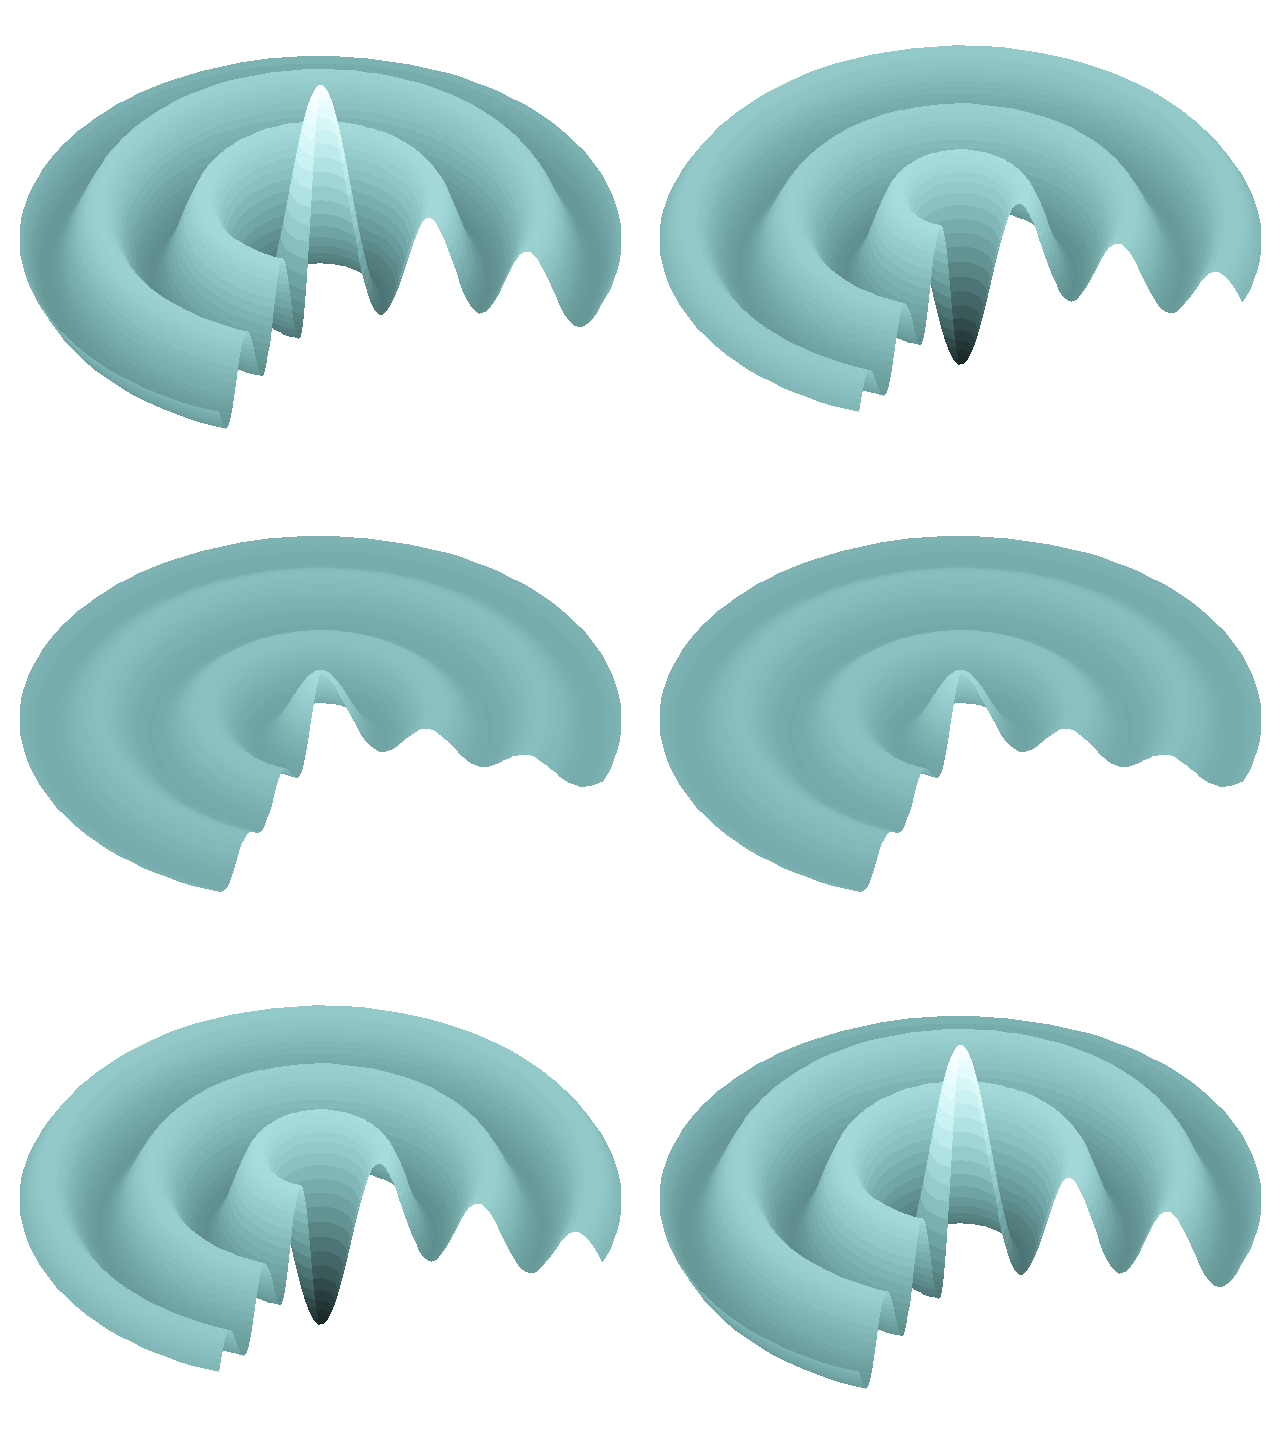
Gnuplot supports a large number of output formats (i.e. terminals). For a compiled C++ program, G3P doesn’t change the default terminal and you can use any of them. On a desktop environment like Linux, it’s most probably Qt terminal. In that case, for animating your plots, the only thing you have to do is to start ploting in a loop and your animation will show up in a pop-up window.
Run bessel.cpp 🛠️
bessel.cpp 🛠️Build and run examples/bessel.cpp on your computer using the following commands to see the bessel animation in a pop-up window:
git clone https://github.com/arminms/g3p.git
cd g3p/examples
cmake -S . -B build && cmake --build build
./bessel
On the other hand, only few of the terminals can produce images/animations suitable for embedding in a Jupyter Notebook (i.e. gif, jpeg, png, pngcairo, svg and recently webp [1]) and G3P supports all of them. That’s why when you create a new g3p::gnuplot instance in a Jupyter Notebook, in order to make the output embeddable in a notebook cell, G3P sets the terminal to pngcairo and pushes the default one by set term push command. But you can switch to any of the above-mentioned terminals based on your needs.
Switching back
You can even switch back to the default desktop terminal to force the output appear in a pop-up window rather than a notebook cell by running the following:
gp("set term pop");gif and webp are the only two terminals that can embed an animation into a web page and we’re going to cover them next.
GIF animations
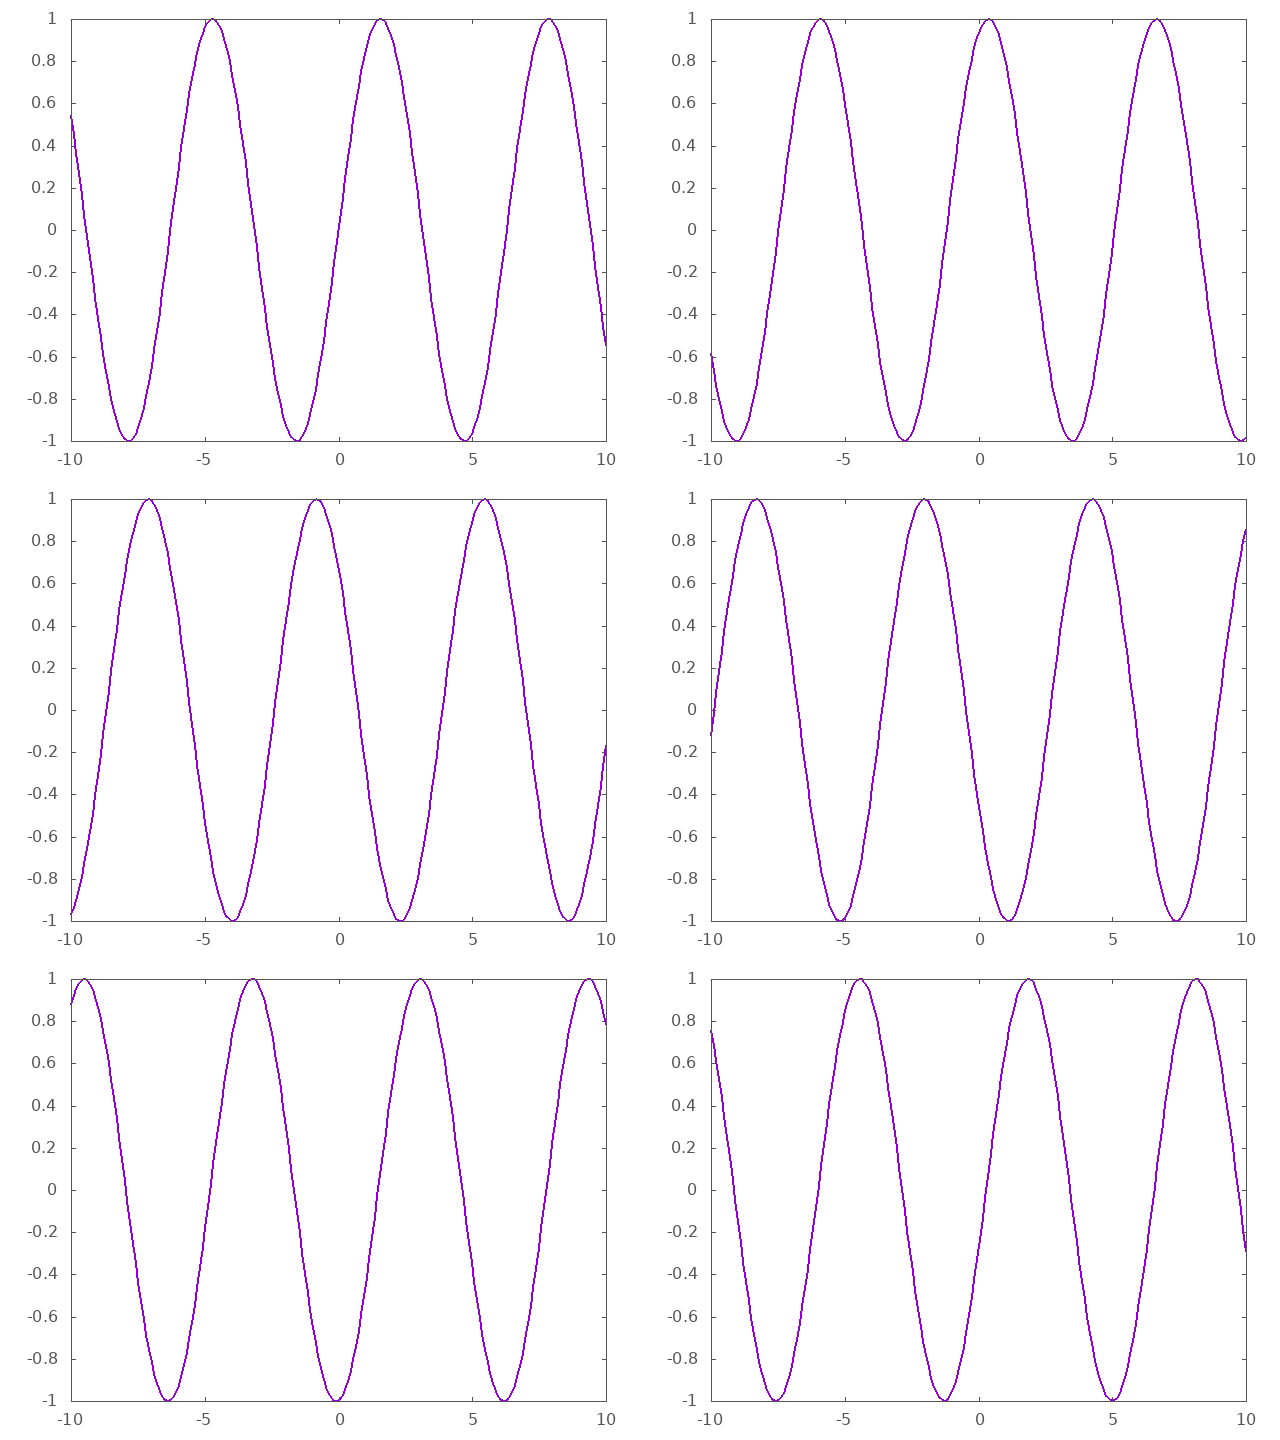
Let’s change the Simple Plot to show a moving sine wave using gif terminal:
Be patient ⏳
Depending on the frame size and the number of frames, it may take a while for a GIF animation to appear in the notebook cell. No worries though, as the following example takes less than a second to appear. 😉
#include <g3p/gnuplot>

g3p::gnuplot gp;
gp ("set term gif enhanced transparent animate")
("set nokey")
("set samples 200")
("set style data points");
for (float i = 0; i < 6; i += 0.2)
gp("plot [-10:10] sin(x + %f) lw 2.0", i);
gp
Animated webp
Starting version 6, Gnuplot added webp terminal that like gif terminal supports animations. The quality is generally better than animated GIF but you have to switch the transparency off as it doesn’t clear the previous frames (probably a bug). You also have to unset the output when you’re finished with the frames to signal it’s done.
Here’s the way you can do the sine wave example using webp terminal:
gp ("set term webp enhanced notransparent animate delay 100");
// turning off transparency ------^

for (float i = 0; i < 6; i += 0.2)
    gp("plot [-10:10] sin(x + %f) lw 2.0", i);

// signaling the animation sequence is terminated
gp ("unset output") // <-- dropping semicolon to show the animationUsing g3p::display in a loop
g3p::display function has an optional 2nd argument for choosing if the previous output should be cleared or not. It’s on by default, meaning if we don’t provide it, the new plot will replace the previous one. We can use this feature to create a dynamic animation effect. There are two downsides for this approach:
- It can only be used in Jupyter Notebooks. For instance, on a static web page like this you have to click on the floating power button as shown in the Try it NOW! ⏯️ box.
- It cannot be played in an endless loop.
That being said, here’s the same sine wave animation implemented using g3p::display in a loop:
// start with a new instance to reset the terminal back
g3p::gnuplot gp;
#include <chrono> // for chrono_literals
#include <thread> // for sleep_for()
using namespace std::chrono_literals;
gp ("set nokey")
("set samples 200")
("set style data points");
for (float i = 0; i < 19; i += 0.2)
{ gp("plot [-10:10] sin(x + %f) lw 2.0", i);
std::this_thread::sleep_for(100ms);
g3p::display(gp);
}Interactive plots
We can use the approach mentioned in the previous section to produce an interactive plot with xwidgets that shifts our sine wave using a slider.
#include <xwidgets/xslider.hpp>
#include <xwidgets/ximage.hpp>

// enable the key
gp("set key");

// creating the slider widget
auto slider = xw::slider<float>::initialize()
  .min(0.0f)
  .max(100.0f)
  .finalize();

// converting the plot to a widget
auto plot = xw::image_from_file(gp.plotfile()).finalize();

XOBSERVE
(   slider
,   value
,   [&](const auto& s)
    {   std::ostringstream value;
        value << s.value;
        gp("plot [-10:10] sin(x + %s) lw 2.0", value.str().c_str()).sync();
        plot.value = xw::read_file(gp.plotfile());
        gp("unset output;set output \"%s\"", gp.plotfile().c_str());
    }
);

slider.style().handle_color = "purple";
slider.value=0.0f;

plot.display();
slider.display();